QTP 11: How to Enable Enhanced Debugging Features
Posted on Mar, 2013 by Admin
QTP 11 (and versions 9-10) installs Microsoft Script Debugger to provide the debugging features in QuickTest Pro scripts. Without the debugging engine, all of the QTP debug features are unavailable. Microsoft Script Debugger ships with an archaic version (7.10.3077) of Process Debug Manager (PDM).
Out of the box, QTP provides limited VBScript debugging capabilities. An automation engineer does not have the ability to view the properties/methods of variables/objects in their full extent. Objects, like Object Repository objects and VBScript objects, do not have their properties and methods exposed.
 Limited Debugging w/ PDM.dll (7.10.3077) – Variables
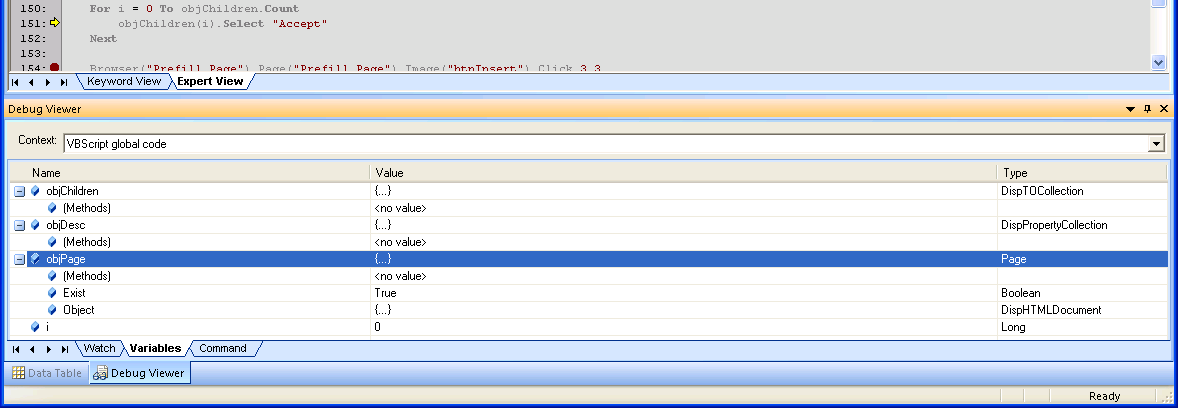
After installing Visual Studio 2008 and Visual Studio 2010, I noticed that the Debug Viewer pane (Watch and Variables tabs) contained additional information (“{…}”) in the place of the usual “<Object>” values. Object types were also explicitly defined.
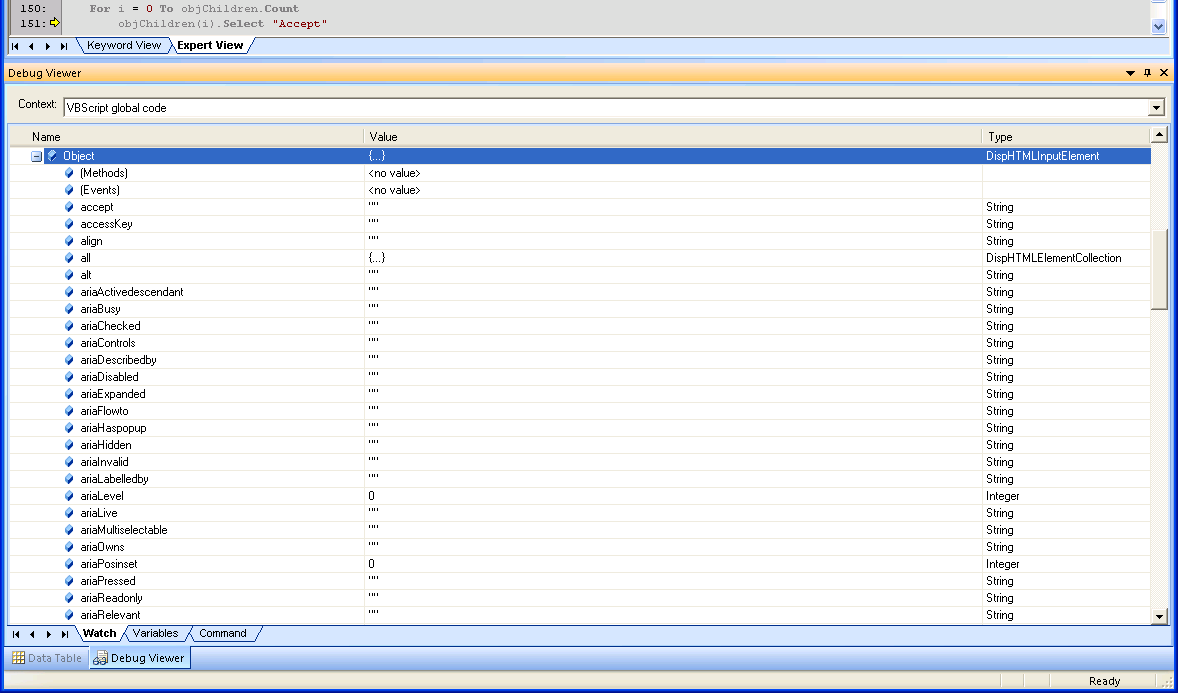
Utilizing the Watch tab of the Debug Viewer provides even more detailed information, including the object’s available properties and methods. The screenshot examples below show the object properties and methods for a QTP WebList object
 Enhanced Debugging w/ PDM.dll (9.0.30729.1) – Variables
 Enhanced Debugging w/ PDM.dll (9.0.30729.1) – Watch (Methods Expanded)
 Enhanced Debugging w/ PDM.dll (9.0.30729.1) – Watch (.Object Expanded)
After further research, I found this is the result of an updated PDM.dll version that is installed and registered with VS 2008/2010. While working on a client’s lab computer, it is extremely unusual to work in an environment where both QTP and VS is installed.
Read more about how script debugging works: How Does Script Debugging Work Internally?
The good news is that an updated version of PDM.dll (9.0.30.729.1) also ships with Internet Explorer 8 – the same version installed with VS 2008. This version has enhanced debugging features which can be utilized to enhance the debugging capabilities of QTP. Methods and properties for all VBSsript objects are not available, but the enhancement is a major upgrade.
Although not a new trick, it is not widely known. When working in a new QTP 11 environment, one of the first tasks I complete is registering the updated version of PDM.dll.
Registering PDM.dll (9.0.30.729.1)
Important: caveat emptor! Read the notes in the next section. If you mess up your QTP install, don’t blame me. Make a backup of your computer first.
To register the version of PDM.dll that ships with IE8, complete the following steps:
- Close QTP.
- Copy C:\Program Files\Internet Explorer\pdm.dll to C:\Program Files\Common Files\Microsoft Shared\VS7DEBUG\pdm.dll.
- Click Start -> Run….
- Type regsvr32 “C:\Program Files\Common Files\Microsoft Shared\VS7DEBUG\pdm.dll”.
- Click OK.
- Restart the computer. (may not be necessary)
- Open QTP and check out the new debugging capabilities.
Notes
It is possible that certain objects and operations can cause QTP to hang when the debug viewer is visible. If you find normal debugging operations impossible to complete due to this fact, try one of the following:
- Set a breakpoint on a different line (to pass over the point of hanging).
- Ensure variables are disposed of properly. (keep the number of variables in the Watch tab limited)
- See HP KB Article: http://support.openview.hp.com/selfsolve/document/KM1392964
- Unregister the new version of PDM.dll.
To unregister the newly registered PDM.dll, complete the following steps:
- Close QTP.
- Delete C:\Program Files\Common Files\Microsoft Shared\VS7DEBUG\pdm.dll.
- Click Start -> Run….
- Type regsvr32 /u pdm.dll.
- Click OK.
- Restart the computer. (may not be necessary)
- Open QTP and resume normal activity.
Conclusion
Please let us know how this tip has help you in the field by leaving a comment below.
