Capturing Windows Perfmon Metrics
Posted on Feb, 2013 by Admin
This is the first in the series of articles about performance monitoring under load and how to use the LoadRunner Analysis tool effectively. In my experience, about 60% to 70% of new LoadRunner users never consider all the monitoring capabilities within the product. They only focus on the end user experience – or Transaction Timings as we call them. An important part of performance test execution is to monitor the vital metrics of the infrastructure hosting the application while under load. How else will you know why the end user timing for “login” suddenly spikes at 243 users? In general, the basic areas to monitor are:
- CPU (utilization and queuing)
- Processes
- Memory utilization
- Disk utilization and queuing
- Network utilization
Let’s start with a Windows OS application since it is common and fairly simple to deal with. For Microsoft Windows infrastructure, Perfmon (Microsoft Performance Monitor) is a utility built into every OS to monitor the five areas mentioned above. LoadRunner has the capability to get these metrics natively so that you can see a live graph and correlate this data to the other graphs (like running virtual users) in real time. This is great, because it allows you to see a hardware bottleneck as it happens. For more information on how to use this, check out the LoadRunner manual on monitoring and the Monitoring Best Practices guide that comes with the product.
Unfortunately monitoring directly may not be possible in real time even though you have discovered this capability. Sometimes there is security or firewall issue between your LoadRunner Controller and the servers you want to monitor. This can prevent you from connecting to the remote machine. Sometimes the server administrators will not allow any kind of access to their servers even for monitoring purposes. Many times they don’t understand that the monitoring is passive for Windows environments, meaning there is no agent to install on the server. LoadRunner is only pulling information from something already available on the machine. Sometimes you just need a baseball bat to prove your point – as I have alluded to with regards to Oracle database monitoring in the past.
For Windows servers that are not accessible real-time, there is a way to monitor system resources in a disconnected way and import the data into LoadRunner’s Analysis tool after the fact. It is not the best solution, but at least it will allow the data to be correlated with all of the other LoadRunner data collected during the test – although after the test is completed. The Analysis tool is very powerful because it is easy to merge and overlay data even for multiple test runs. Reporting test analysis across the entire technology stack from within a single tool is better than looking at screenshots, and the output is much more aesthetically pleasing than standard MS Excel graphs.
To gather this data, performance monitor (perfmon) logs need to be captured from the servers that should be monitored. This will require local or remote access to the servers with correct permissions to perfmon objects. We are assuming the performance engineer has been denied this level of access, so a server administrator or similar role within the project team with access will need to set this up. It is possible to monitor multiple servers from one location; in cases where the servers are behind a firewall, there needs to be only one log. Below is a list of 10 steps that walk you through gathering perfmon data. In this example, screen shots and steps are for Windows Server 2008.
Step 1: Login and open the “Server Manager” console. The easiest way to do this is from the “Start” menu, right click on “Computer” and select “Manage.”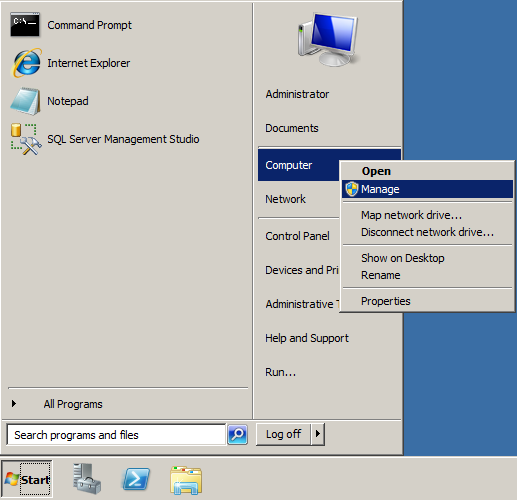
Step 2: Navigate/Traverse into “Diagnostics -> Performance -> Data Collector Sets-> User Defined”.
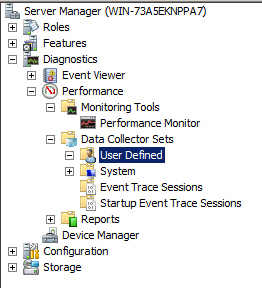
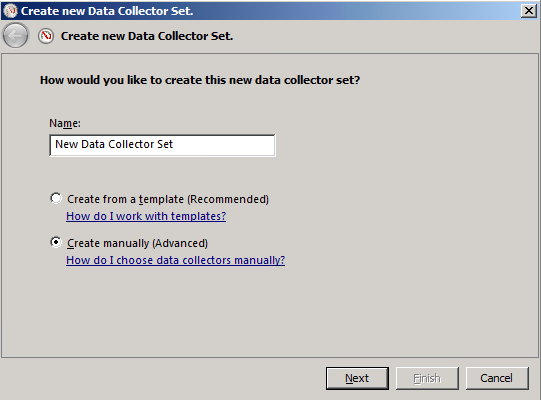
Step 3: Right click on “User Defined” and select “New, Data Collector Set.” This will open up the “Data Collector Set” wizard. Give the data set a unique name. Select the “Create manually (Advanced)” radio button option, and click “Next.”
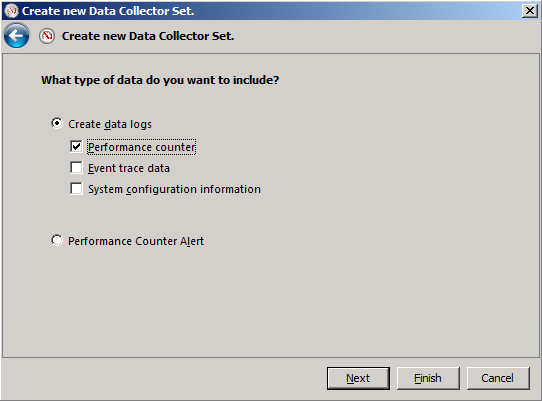
Step 4: On the next page, select the “Create data logs” radio button and select only “Performance counter” from the check boxes available. Click the “Next” button to go to the next step.
Step 5: Add the monitors you would like to log. Clicking the “Add” button will give you a list of available counters. Go through the list and add any pertinent counters that should be logged. Click “OK” when finished selecting counters.
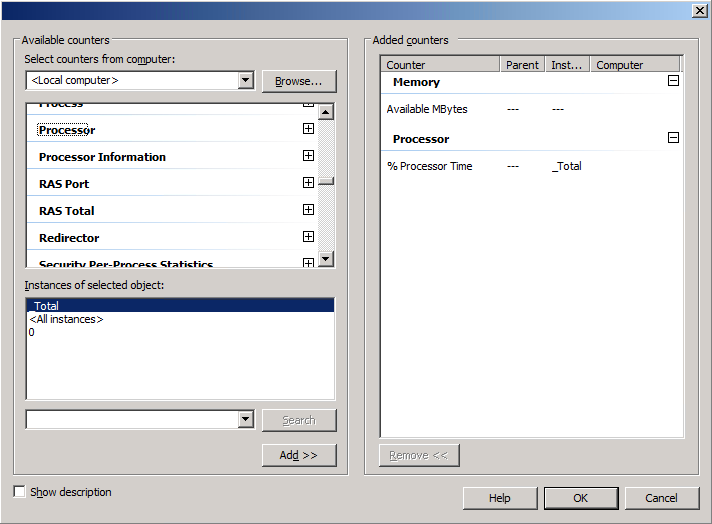
This is where both the performance engineer and the server administrator ask me, “How do I know what to select?” For this, I would consult the LoadRunner Monitoring Best Practices guide that comes with LoadRunner. Microsoft has plenty of articles on how to use Perfmon, and what to choose when looking for bottlenecks and key thresholds for metrics to know when there is an issue, such as this one:
http://technet.microsoft.com/en-us/magazine/2008.08.pulse.aspx
You don’t want to monitor everything on every machine. This can lead to skewed results because additional load is being placed on the servers just to gather the metrics. The more counters you add, the more overhead placed on the servers. Try to shoot for no more than 3 to 5 percent overhead.
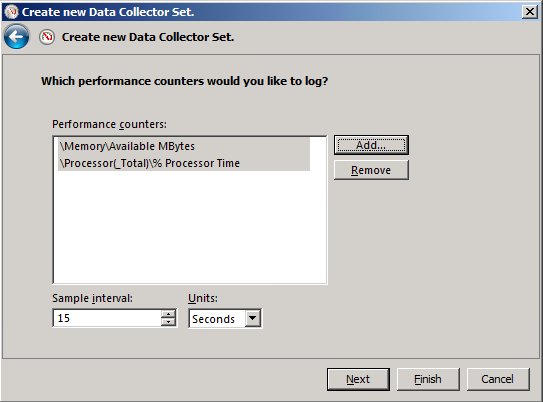
Step 6: Once the counters are selected for logging, enter the sample interval. Usually 15 seconds is sufficient. Adjust according to the test length. Use longer durations for longer tests and shorter durations for shorter tests. Click “Next” to go to the next step.
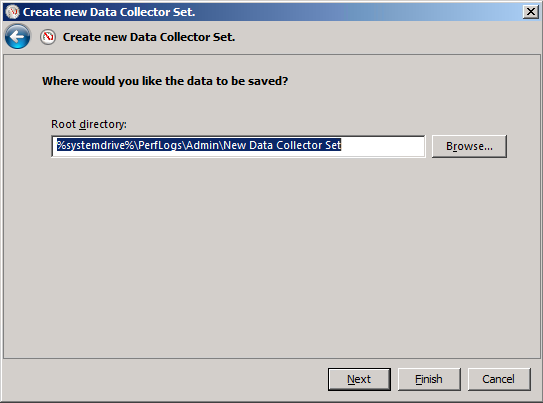
Step 7: Determine the location for the log. Make sure to select a location with sufficient space, since it is possible for the log file to get very large if there are a large number of monitors running for long periods of time. This file will need to be moved from the server to a location where the performance engineer can access it. This may also be something the server administrator may need to schedule to perform manually.
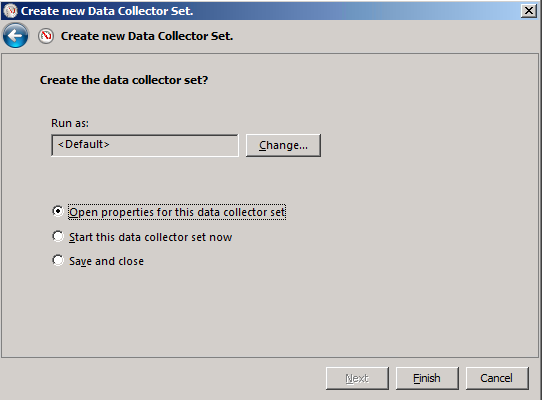
Step 8: Select the account that runs the data collector set (Run As). Then select the “Open properties for this data collector set” radio button. DO NOT select “Start this data collector set now” to start logging immediately, because there is one more step to perform before logging should begin. Click “Finish” to close the wizard.
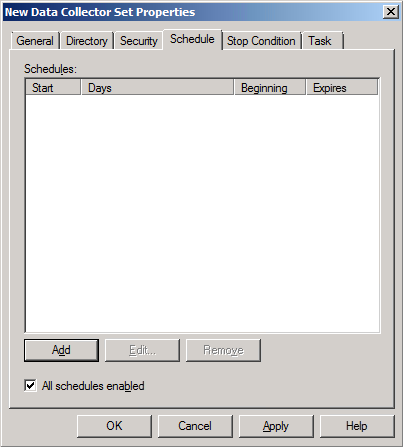
Step 8: To open the properties for the Data Collector Set use the “Server Manager” page by selecting the “User Defined” tree element and selecting the Data Collector Set, then right clicking on it to select “Properties”. There are a number of items that can be changed, but for our purposes now the setting to change is the schedule, so that monitoring can be gathered unattended or after hours. Click the “Schedule” tab and click “Add” to schedule a start time for the logging. Select the date you want to start logging, the time, and what days of the week if you want to run this at the same time every day.
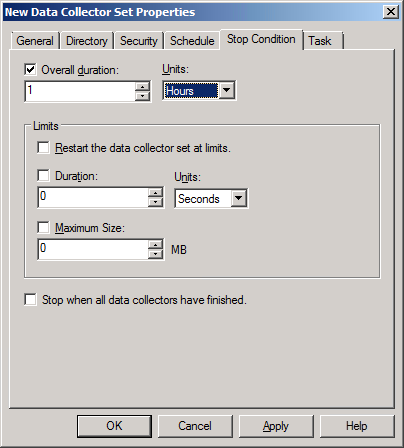
Step 9: Set a stop time. Do this by clicking on the “Stop Condition” tab. Set an “Overall duration” or use a limit. You don’t need to set a start time to use the “Stop Condition”.
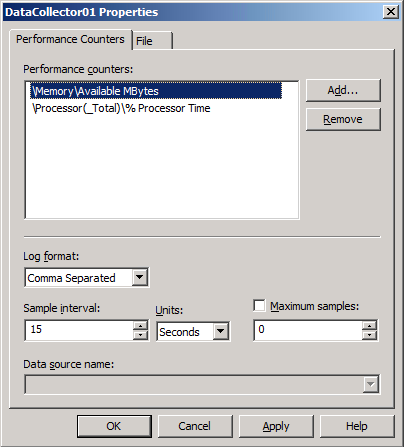
Step 10: This step is VERY important. The default format for the log file is binary, which LoadRunner can’t parse natively. Change this setting to CSV. Click on the Data Collector Set on the tree element, and select your Data Collector – then right click to select “Properties.” There should be a properties window like the one below. If not, make sure you select the Data Collector and not the Data Collector Set (Data Collector is a child of Data Collector Set). Change the “Log format” to “Comma Separated.” At this point, it is possible to add or remove monitors and change the sample interval in case something needs to change at the last minute. Click on File to specify the file format if you plan on having multiple logs. Click the “OK” button.
Don’t tell the server admin, but if they accidentally forget to set it to CSV format and send you binary format (BLG) instead, you can fix it. But first make sure to complain for at least an hour and make them buy you lunch for screwing up your day. To convert from binary to CSV, use the “relog” command. Here is information on it and the syntax to use:
http://technet.microsoft.com/en-us/library/bb490958.aspx
Martin Spier wrote an article about this is 2010 with more information about this:
http://martinspier.co.uk/convert-windows-performance-monitor-perfmon-log
Now there are metrics being gathered during load which we can use in the Analysis tool. Now we need to get the data imported into the LoadRunner Analysis tool and correlated with the rest of the test results. In the next article in this series I’ll show you how to do just that.
